
How To
10 minutes read
How to Calculate Churn Rate: Understanding Churn Rate


In short:
- Churn rate measures the percentage of customers or subscribers who stop using your service during a specific period.
- To calculate churn rate, divide the number of customers lost by the total number of customers at the start of the period, then multiply by 100.
- Tracking churn rate helps businesses spot retention problems early and improve long-term growth.
In business, profitability is king, and understanding the churn rate is the key to unlocking higher profits.
This blog will provide a comprehensive guide on this metric – concept, impact, calculation methods, and essential insights.
What is Churn Rate
The churn rate definition, also known as the attrition rate, indicates the number of customers who stop using a business’s products or services during a specific time period.
This metric is particularly important for companies with recurring revenue models like from subscriptions, memberships, or contracts (Example: Spotify, Netflix, etc)
A high churn rate signifies that a significant number of customers are leaving, which can suggest dissatisfaction with the products or services or a preference for a competitor’s offerings. On the other hand, a low churn indicates customer satisfaction and loyalty to the business.
Recommended Read: Customer Retention Rate Vs Churn Rate
Calculation Of Churn Rate
This metric, alongside retention and growth rates gives an idea about the financial health of a business. A company is considered healthy and growing if its growth rate surpasses its churn.
Here’s how you calculate churn rates:
Churn Rate Formula
Churn Rate = (Number of Customers Lost during a Period / Total Number of Customers at the Start of the Period) x 100
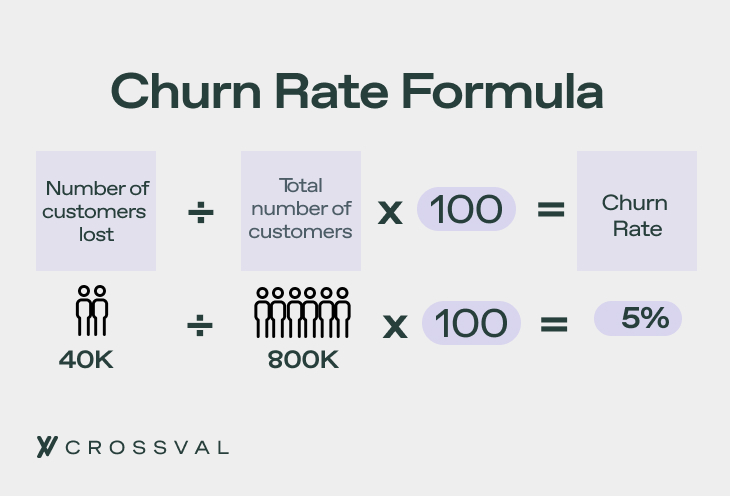
To illustrate, consider a subscription-based business that begins the month with 800 customers and loses 40 by the end of the month. Using the formula, the customer churn for that month is calculated as:
Churn Rate = (50 / 800) x 100 = 5%
This formula is versatile and can be used for various categories such as customers, subscribers, or users, depending on the type of business. The unit being measured might change, but the formula stays the same.
Adjusted Churn Rate
To calculate the churn rate for any period, a simple formula can be used, but high-growth companies may need a more complex method for accuracy.
When a business is expanding rapidly, the influx of new customers can mask the number of those leaving, making the simple formula less effective.
An adjusted churn rate formula accounts for this:
(C / [(A+B) / 2]) x 100 = D
Here,
- A = is the number of customers at the start of the period
- B = is the number at the end
- C is the number who left
- D is the churn rate percentage
This formula provides a clearer picture by balancing the customer numbers over the period.
Seasonal Churn Rate
Seasonality is another factor to consider, as businesses often experience varying demand throughout the year. For example, a ski rental business might see more customers in winter.
To account for these fluctuations, the seasonal churn rate formula is used:
{[ (A x B) + (C x D) ] / (A+C)} x 100 = E
Here,
- A = number of customers during peak periods
- B = the churn during peak periods
- C = the number during low periods
- D = churn during low periods
- E = annual churn rate percentage, reflecting seasonal variations.
Revenue Churn Rate
Revenue churn rate offers another perspective, considering the revenue impact of lost customers. The formula is:
(A/B) x 100 = C
Here,
- A = the lost revenue
- B = the total revenue
- C = the revenue churn rate percentage.
For example, if a business had $200,000 in total revenue and lost $30,000, the revenue churn would be 15%.
These methods provide a more comprehensive view of churn, which is essential for businesses to understand and address customer retention effectively.
Recommended Read: A Beginner’s Guide to Different Revenue Models
Methods to Calculate
There are several ways to answer how to calculate this metric, which can vary based on the business model and the data available. Here are some common methods:
Direct Method
This approach tracks the exact number of customers who have stopped using your product or service within a specific time frame.
To find the churn, divide this number by the total number of customers at the start of that period. This method provides a clear and direct measurement of customer loss.
Indirect Method
When direct tracking isn’t possible, the indirect method offers an alternative. This involves examining customer engagement metrics like reduced usage, less frequent purchases, or decreased interactions with the product or service.
By identifying customers showing these signs, you can estimate the churn. This method relies on identifying patterns that typically precede churn.
The indirect method examines customer engagement metrics to estimate churn.

Survival Analysis:
This statistical approach studies the time until customers churn.
By analyzing how long customers remain before they leave, businesses can estimate churn rates over a given period. This method also helps pinpoint factors that may influence customer retention or loss.
Selecting the best method to calculate the churn rate depends on the data available and the nature of the business.
Regardless of the method chosen, it is crucial to apply it consistently and monitor this metric regularly.
This practice allows businesses to detect trends and make informed decisions to improve customer retention. Tracking this metric systematically helps in identifying issues and opportunities for growth, ensuring long-term success.
Benefits of Churn Rate
Understanding Product Value
The churn rate is a valuable metric for assessing how well a company’s product or service meets customer needs.
A consistently high churn indicates that many customers are leaving, suggesting there may be issues with the product or service that need addressing.
To identify these issues, companies can conduct surveys, hold focus groups, or solicit customer reviews.
By understanding why customers leave, companies can implement strategies to improve their offerings and encourage customers to stay.
Assessing Fiscal Health
Regular calculation of the churn rate, either monthly or annually, allows companies to monitor their performance over time. Observing trends in this metric can reveal improvements or fluctuations in customer retention.
This metric also aids in predicting the company’s future financial performance, providing valuable insights for planning and decision-making.
Limitations of Churn Rate
Lack of Customer Detail
Along with the above-mentioned advantages, there are notable disadvantages to relying solely on the churn rate. One significant limitation is that it doesn’t provide details about the specific customers who are leaving.
For example, new customers might be more likely to churn compared to long-term customers, but the churn rate doesn’t distinguish between these groups.
This lack of detail can make it difficult to understand the full context behind the churn numbers.
Service Differentiation Issues
Another limitation is that the churn rate doesn’t account for the different types of services a business might offer. Companies often provide multiple subscription levels with varying features and costs. For instance, customers on a free trial may not contribute any revenue, yet their departure will still count towards the churn rate.
In such cases, it might be more useful to calculate the recurring revenue loss rather than just the number of customers who churn. This approach gives a clearer picture of the financial impact of customer turnover.
Recommended Read: How to Forecast Revenue – A Step by Step Guide
Growth Rate Considerations
Sometimes, a sudden increase in customer growth can lead to a higher churn rate as the newly acquired customers might not all continue their subscriptions.
Churn alone does not account for new customer acquisition, making it less effective in portraying overall business development.
The growth rate, which measures the number of new subscriptions in a specific timeframe, can offer a more comprehensive view of business progress.
Recommended Read: Customer Acquisition Cost Vs Customer Lifetime Value
What is a Good Churn Rate?
In an ideal world, the best churn rate a company can aim for is 0%, which means that it retains all its customers.
However, achieving a 0% is rare, as it is common for businesses to lose some customers each month.

Many companies strive for a churn rate between 5% to 7%, which is generally considered good. This acceptable range, though, can differ based on the size of the company and the industry it operates in.
For instance, larger companies might experience a different standard for a good churn rate compared to smaller businesses due to differences in customer base and market dynamics.
Similarly, industries such as telecommunications, software-as-a-service (SaaS), and subscription-based services might have different benchmarks for acceptable churn rates.
The acceptable churn rate is not a one-size-fits-all number; it is influenced by various factors unique to each business. Therefore, to evaluate whether your churn is acceptable, compare it with industry averages and track changes over time.
A churn that is much higher than the industry average could signal potential problems that need addressing to enhance customer satisfaction and retention.
Recommended Read: How to Calculate Customer Acquisition Cost for Your Business
What does a High Churn Rate Indicate?
A higher churn rate indicates that more customers are leaving your business, while a lower one shows that more customers are staying.
Knowing this distinction helps in making informed strategic decisions to improve customer retention.
Maximizing Retention: Strategies to Reduce Churn Rate
Reducing churn requires proactive measures and a solid understanding of customer needs. Here are several effective strategies to mitigate churn and boost customer retention:
Enhance Your Product or Service
Regularly collect customer feedback and use it to improve your offerings. Address any pain points, introduce new features, and provide excellent customer support to ensure a positive experience.

Improve the Onboarding Process
A smooth onboarding process is key to customer retention. Offer clear instructions, tutorials, and resources to help new customers fully utilize your product or service from the start.
Segment Your Customers
Divide your customer base based on criteria such as demographics, behavior, or engagement levels. This allows for personalized communication and marketing efforts that address the specific needs and interests of different customer groups.
Implement Customer Success Programs
Develop programs that actively engage with customers, understand their goals, and help them succeed using your product or service. This creates a sense of partnership and loyalty, reducing the likelihood of churn.
Offer Incentives and Rewards
Create loyalty programs, referral incentives, or exclusive benefits to encourage customers to stay. Providing ongoing value and rewards helps increase customer loyalty and reduce churn.
By applying these strategies and regularly monitoring churn rates, you can make informed decisions to improve customer retention and support business growth.
Recommended Read: How to Calculate Retention Rate & 6 Strategies to Optimize it
Conclusion:
Finding a business’ churn is very important for any business, and reducing it is more crucial for improving business profits and growth.
Let CrossVal help by enabling you to build accurate financial models in just four minutes.
Try CrossVal today and gain comprehensive insights into complex financial terms. Elevate your company’s financial strategy and performance with CrossVal! Create your free account now and try it free for 14 days.


ajinkya
CrossVal Finance Team
The CrossVal team combines expertise in accounting, tax compliance, and financial technology to help UAE businesses automate their finance operations. Our content is reviewed by chartered accountants and finance professionals with experience in FTA regulations.
LinkedIn


