
Cash Flow Management
6 minutes read
Free Cash Flow Conversion Formula Explained Simply


In short:
- Free cash flow conversion measures how efficiently a company turns its accounting profits into actual cash that’s available for use.
- The formula is: Free Cash Flow Conversion = Free Cash Flow ÷ Net Income.
- A higher ratio means the business is great at generating cash from its profits, which is key for growth, paying debt, or returning value to shareholders.
Free Cash Flow (FCF) Conversion is a critical financial metric that helps businesses understand how efficiently they turn operating profits into actual cash flow. In this guide, we’ll break down the formula, its importance, and how to improve it.

What Is Free Cash Flow (FCF) Conversion?

FCF Conversion measures how much of a company’s earnings (before interest, taxes, depreciation, and amortization) is converted into free cash flow. It’s especially valuable for investors and CFOs tracking liquidity and operational performance.
FCF Conversion Formula
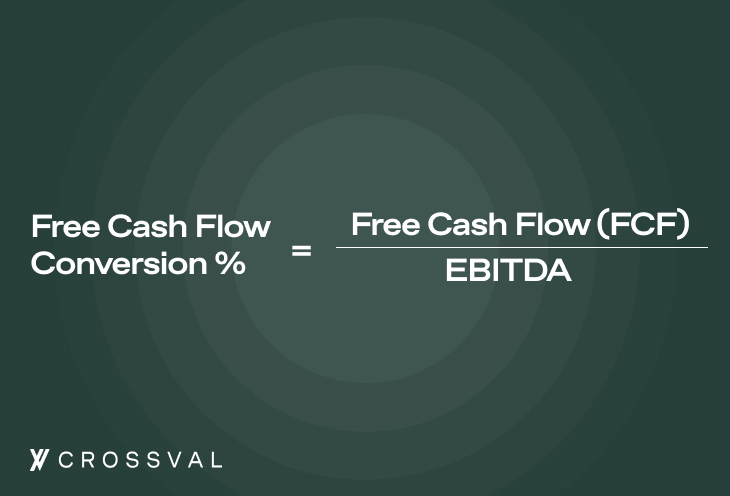
The formula for Free Cash Flow Conversion is:
Free Cash Flow (FCF) Conversion = Free Cash Flow / EBITDA
Where:
- Free Cash Flow (FCF) = Cash Flow from Operations – Capital Expenditures
- EBITDA = Earnings Before Interest, Taxes, Depreciation, and Amortization
This simple formula gives insight into how much of a company’s EBITDA is actually being turned into usable cash.
How to Calculate Free Cash Flow Conversion
Let’s say a company has:
- Cash Flow from Operations: $500,000
- Capital Expenditures: $200,000
- EBITDA: $600,000
Then:
- Free Cash Flow = $500,000 – $200,000 = $300,000
- FCF Conversion = $300,000 / $600,000 = 0.5 or 50%
This means the company is converting 50% of its EBITDA into free cash flow.
Why FCF Conversion Matters
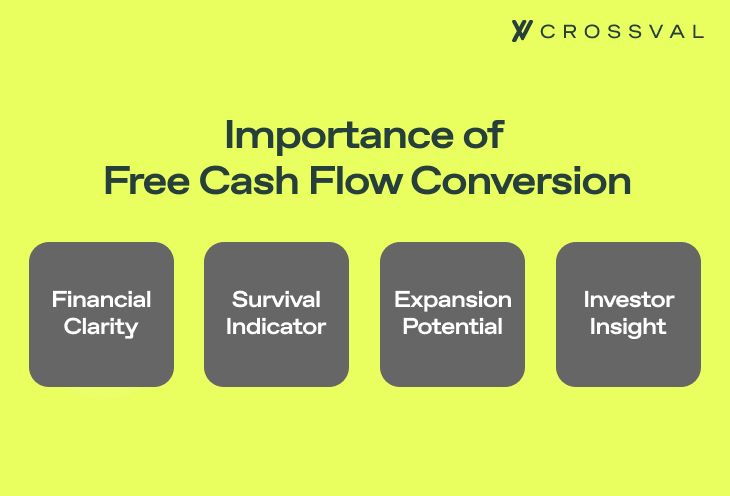
A higher free cash flow conversion rate means better financial health, operational efficiency, and cash generation capability. Investors and analysts view this metric as a signal of a company’s ability to:
- Fund growth internally
- Pay down debt
- Return capital to shareholders
Ideal FCF Conversion Rate
- A conversion rate of 100% (1.0) is considered excellent.
- Rates above 100% may result from temporary working capital benefits.
- Low FCF conversion ratios could suggest inefficiencies or high capital requirements.
Ways to Improve Your FCF Conversion Ratio
- Improve Accounts Receivable Collection: Faster collections lead to improved operational cash flow.
- Negotiate Supplier Terms: Longer payment terms can preserve cash.
- Manage Inventory Efficiently: Avoid overstocking to reduce capital tied up in inventory.
- Cut Unnecessary Capital Expenditures: Ensure that every CapEx has a clear return on investment.
Free Cash Flow to EBITDA Ratio
Another way this metric is referred to is the Free Cash Flow to EBITDA ratio, which is just another name for FCF Conversion. Make sure to monitor this over time to see whether operational efficiency is improving.
FAQ: Common Questions About FCF Conversion
Q: What is the FCF conversion formula? A: Free Cash Flow divided by EBITDA. It measures how much cash is generated per dollar of EBITDA.
Q: How to calculate free cash flow conversion? A: Subtract capital expenditures from cash flow from operations, then divide by EBITDA.
Q: What is a good free cash flow conversion ratio? A: Generally, 80% and above is strong. 100% is ideal. Below 50% may indicate inefficiencies.
Q: What affects the FCF conversion rate? A: Working capital movements, CapEx, and operational cash flow practices.
Q: Is free cash flow conversion the same as FCF to EBITDA? A: Yes, they refer to the same concept.
If you want to make better investment or management decisions, tracking your free cash flow conversion formula is one of the smartest moves you can make.
For businesses looking to track and forecast this efficiently, financial reporting tools like CrossVal can help automate and visualize these key metrics.
Build Customized Financial Models In Minutes
Imagine spending less time on repetitive financial tasks and more on strategic decisions. That’s CrossVal for you – a tool where financial management meets automation and lightning speed.
What takes 3 weeks to build on Excel or spreadsheets, CrossVal can do in 4 minutes.
It’s a plug-and-play system that helps with financial management, forecasting, reporting, analysis, and valuations.
It seamlessly integrates with QuickBooks, HubSpot, Stripe, and more, bringing all your financial data into one smart hub.
What is a Good Free Cash Flow Conversion Rate
A good Free Cash Flow Conversion Rate indicates how efficiently a business turns its net revenues into cash.
Ideally, a ratio of 1 means all net revenues become cash, though this is rare. Here’s what different ratios mean:
- Ratio < 1: Not all net profit converts to cash, suggesting potential liquidity issues.
- Ratio > 1: Excess cash, possibly from upfront payments or reduced costs, limiting investment in growth.
This rate also helps investors gauge if a company’s stock price aligns with its actual cash generation.
Calculation methods vary by company and require judgment. Monitoring this rate over time reveals a company’s financial performance trends and improvements.
FCF Conversion Above 100: What Does it Mean?
An FCF conversion ratio above 100% means that a company is generating more free cash flow than its reported EBITDA. In other words, it’s converting more than 100% of its operating earnings into real cash—a strong sign of financial efficiency.
This can happen when non-cash charges (like deferred revenue adjustments or working capital reductions) boost free cash flow, or when the company operates with minimal capital expenditure and highly efficient cash collection processes.
While this is generally a positive indicator, consistently high FCF conversion above 100% may also warrant a closer look. It could be driven by one-off events such as asset sales, changes in working capital that aren’t sustainable, or underinvestment in CapEx.
What is FCF/EBITDA Ratio?
The FCF/EBITDA ratio measures how efficiently a company converts its operating profits into actual free cash flow.
EBITDA (Earnings Before Interest, Taxes, Depreciation, and Amortization) is a proxy for operational profitability, while Free Cash Flow (FCF) represents the cash that remains after covering capital expenditures and working capital needs.
By comparing the two, this ratio gives insight into how much of a company’s accounting profit turns into real, spendable cash.
A high FCF/EBITDA ratio suggests that a business has strong cash conversion, with low capital intensity and efficient working capital management.
On the other hand, a low ratio may indicate that a large portion of EBITDA is tied up in asset investments, inventory, receivables, or other cash outflows.

Read more:
- Company Cash Flow Planner – Download Free Excel Template
- Difference Between Cash Flow Statement And Cash Budget
- Incremental Cash Flow: Definition, Formula, and Examples
- Cash Flow Vs Gross Revenue – Understanding The Differences
- Understanding Discounted Cash Flow Valuation (DCF)
- Cash Flow Survival Plan for UAE Startups
- Unlevered vs. Levered Free Cash Flow: Key Differences

ajinkya
CrossVal Finance Team
The CrossVal team combines expertise in accounting, tax compliance, and financial technology to help UAE businesses automate their finance operations. Our content is reviewed by chartered accountants and finance professionals with experience in FTA regulations.
LinkedIn


